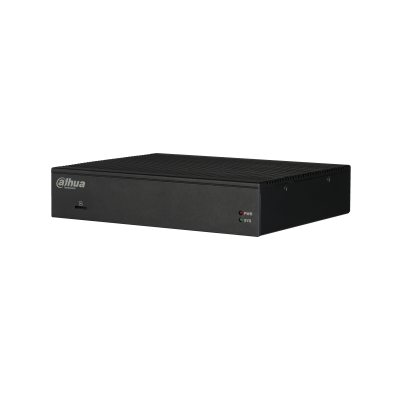
ILS1000
iLinksView Network Management Platform
> Network management platform
> Discover devices automatically, such as switches, IPCs and NVRs
> Visual management of network topology
> Real-time device monitoring: Online/offline status and link status of devices
> Chart statistics: Visual and graphical statistics display
> Wide temperature range: -10°C to 55°C
Intelligent Analysis
Switch Statistics
Switch online/offline statistics
IP Device Statistics
IP device online/offline statistics
Port Usage
Usage statistics of switch ports
CPU Usages
Display the top 9 switches with most CPU usages
Total bandwidth of port
Total bandwidth statistics of port
Alarm Statistics
IP conflict alarm, switch status alarm, terminal status alarm, loopback alarm, port congestion alarm
Dynamic View
Device Discovery
Dahua managed switches
Dahua terminal devices, such as IPC, NVR
SNMP switchesNetwork Topology
Display managed switches
Display unmanaged switches
Display IP devices
Display network link statusNetworking Mode
Support discovery and identification of cascading, star, aggregation and other networking;
Network Device
Switch
Display the detailed information of switches, such as name, mode, SN, IP, MAC and status.
Terminal Device
Display the detailed information of IPCs, NVRs and other devices, such as name, type, mode, IP, MAC, manufacturer and status.
PoE Management
Display the power consumption of switches, including total and used power consumption. And remotely control the PoE switch.
Alarm Message
Alarm Message
Support IP conflict alarm, switch status alarm, terminal status alarm, loopback alarm, port congestion alarm
System Management
Maintenance
One click to reset
Support upload of upgrade package
Support import and export of configuration file
Support system logWeb Management
Support HTTPS and HTTP login
Performance
Supported Device
1000 switches
10,000 portsPerformance
Power Consumption
15W
Memory
2 GB
Ethernet port
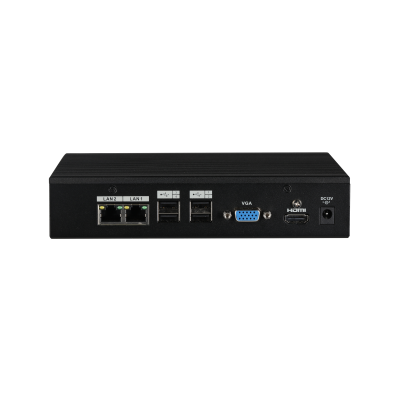
2 × 10/100/1000 M RJ-45 ports
Indicator
PWR indicator and SYS indicator
Operating Temperature
-10°C to 55°C (14°F to 131°F)
Operating Humidity
5%–95%
Dimensions (L × W × H)
155 mm × 135 mm × 30 mm (6.10" × 5.31" × 1.18")
Weight
1.6 kg (3.53 lb)


